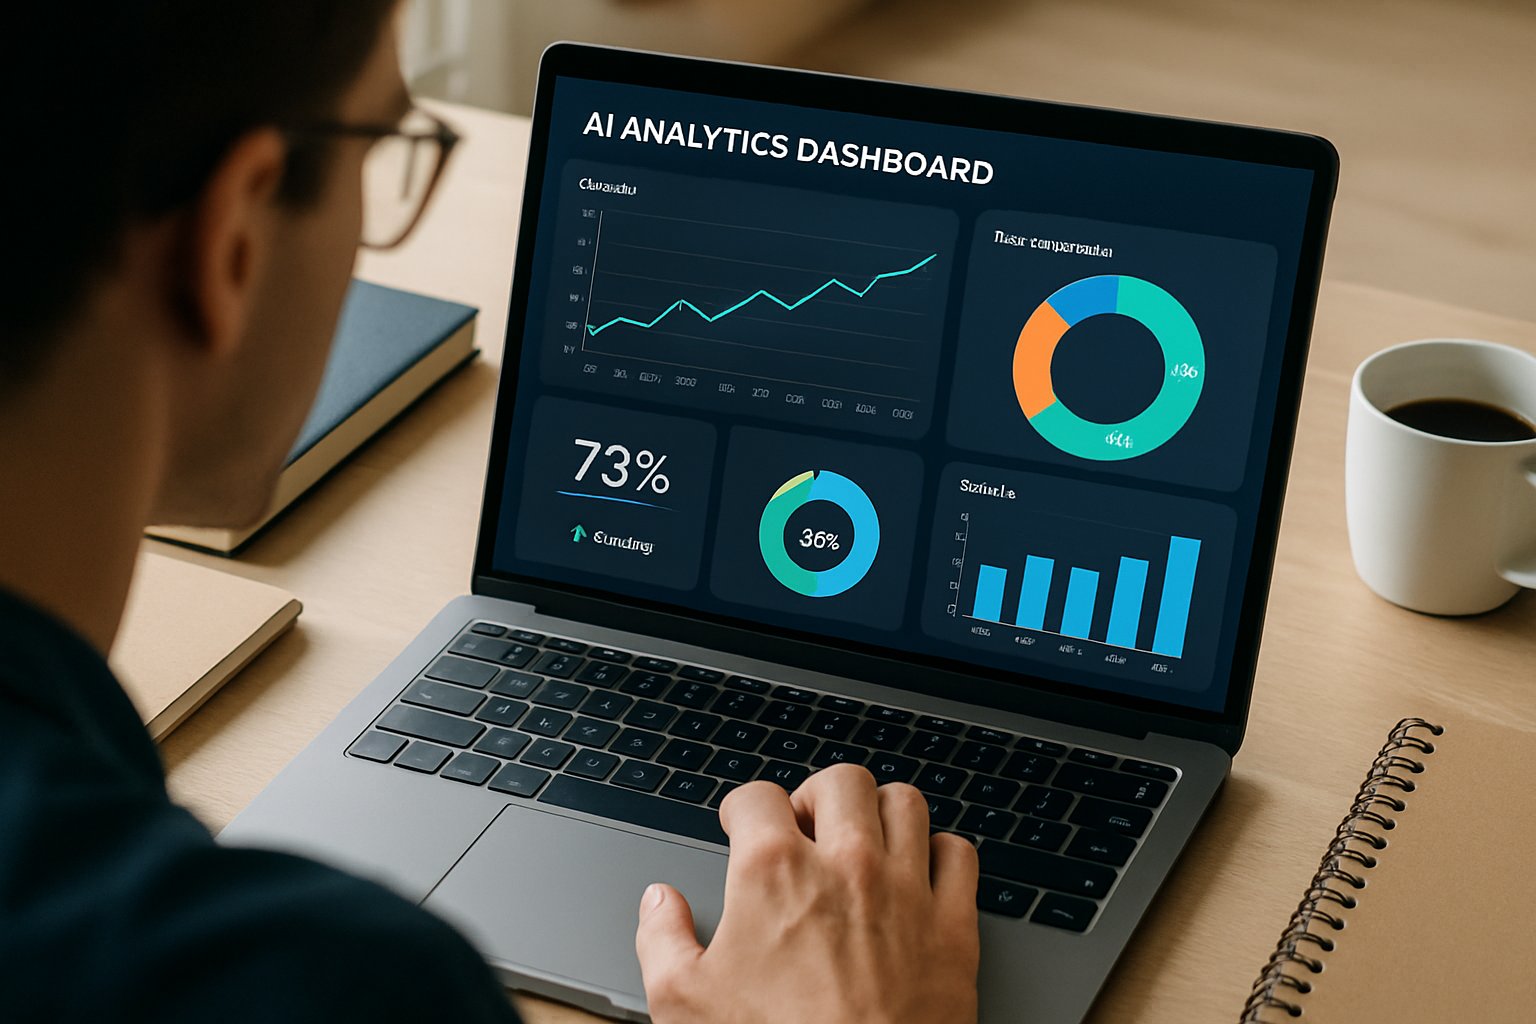
Building an AI analytics dashboard for enterprise monitoring
Enterprises are scaling AI from pilot to production at record speed. Yet many leaders still cannot see how models influence revenue, risk, and productivity. An AI analytics dashboard closes that visibility gap by linking code execution to business outcomes quickly. HR, L&D, and product teams gain clear insights without wading through raw logs.
Consequently, decisions accelerate, governance strengthens, and ROI conversations stay grounded in facts. This article walks you through building a reliable, governance-ready platform step by step. We draw on AdaptOps experience, observability research, and frontline deployment lessons. Additionally, we outline design patterns that knit together data, model, and operations telemetry. Moreover, we discuss how quick-start pilots prove value before enterprise scale. Whether you manage SaaS onboarding or global IT ops, these tactics will help. Let’s explore the essentials.
AI Analytics Dashboard Essentials
Start with business questions, not logs. Stakeholders care about conversion lift, cycle time, and compliance exposure. Therefore, identify 3–7 SMART KPIs before instrumenting any metric collectors. Example KPIs include handle time reduction, fraud loss avoided, and license utilization.
Adoptify’s prebuilt ROI tiles accelerate this mapping by suggesting industry benchmarks. Furthermore, connect each KPI to supporting model, data, and infra measures. This alignment drives trust because every metric rolls into value language executives understand. Regular reviews keep metrics relevant as objectives evolve.
In short, value-first scoping sharpens dashboard focus. Next, we map concrete KPIs to monitoring layers.
Business KPI Alignment First
Many teams rush to stream embeddings before defining revenue impact. Instead, tie each metric to a named owner and financial target. For instance, HR may track onboarding hours saved per cohort. Meanwhile, sales may follow lead qualification lift per quarter.
Use the AI analytics dashboard to display these KPIs on the first screen. Consequently, meetings shift from speculation to measurable deltas. Additionally, role-based widgets keep numbers relevant for every stakeholder. Scheduled reviews ensure accountability persists beyond project launch.
Clear KPI ownership ensures accountability. With ownership set, you can monitor three vital dimensions.
Three Key Monitoring Dimensions
Effective monitoring covers model quality, data health, and operational performance. Model quality metrics include accuracy, calibration, and hallucination rate for LLMs. Data health tracks drift, missing values, and schema violations. Operational performance monitors latency, throughput, and cost per inference.
Together, these pillars offer a single pane view. Your AI reporting tools should feed each pillar with timely signals. Moreover, the AI analytics dashboard can correlate spikes across pillars to speed troubleshooting. Consider the following quick checklist.
- Model: F1, slice analysis, explainability scores
- Data: PSI drift, schema changes, OOV rates
- Ops: p95 latency, error counts, MTTR
Monitoring all three dimensions prevents silent degradation. Next, design alerting that respects human attention.
Practical Design And Alerting
Alert fatigue kills trust faster than bugs. Therefore, prioritize leading indicators and dynamic thresholds. Adopt EWMA bands or percentile windows instead of static numbers. Additionally, route alerts through role-based channels.
Executives receive weekly KPI digests, while engineers get real-time traces. Your AI reporting tools should allow emoji-free Slack alerts and detailed Grafana links. Use the AI analytics dashboard to embed incident playbooks beside each metric. Teams then move from chaos to orderly triage.
Good alerting preserves focus and speed. We now examine tool choices that enable this design.
Hybrid Tooling Stack Strategy
No single vendor covers every layer. Consequently, enterprises adopt a hybrid stack. Infra telemetry stays in Prometheus, Datadog, or New Relic. Model and LLM signals route through Arize, Fiddler, WhyLabs, or Langfuse.
Grafana then unifies visuals, while Adoptify orchestrates governance workflows. Integrations happen through APIs, event buses, or direct database reads. Choose AI reporting tools that expose open APIs to avoid lock-in. The AI analytics dashboard should merge these feeds without duplicating storage.
Automated tests must validate every data contract during CI/CD. A composable stack balances capability and cost. Governance ties the pieces together, which we cover next.
Governance And Training Integration
Dashboards succeed only when people act on them. Adoptify’s AdaptOps embeds change-control workflows and certifications beside each metric. Consequently, approvals, retrains, and rollback decisions gain audit trails. Interactive in-app guidance trains users within context, shortening learning curves.
Moreover, role-based learning paths align with stakeholder needs. Fuse tamper-evident logs with compliance reports so regulators stay satisfied. Integrate the AI analytics dashboard into onboarding to reinforce best practices. This loop of insight and action sustains performance.
Governance and training turn data into durable value. Specialized considerations arise for LLM and agent systems.
LLM And Agent Considerations
Generative systems create new observability challenges. Track token usage, prompt versions, and hallucination rates. Additionally, log tool and chain traces for agent workflows. Provide human review queues linked to disputed outputs.
Your AI reporting tools must capture embedding drift and cost per thousand tokens. Finally, feed annotations back into retraining pipelines. Detailed generative telemetry prevents reputation damage. With monitoring covered, let’s recap and outline next steps.
Conclusion And Next Steps
A modern AI analytics dashboard aligns business KPIs with model, data, and ops signals. When paired with smart alerting, hybrid tools, and AdaptOps governance, it drives measurable value.
Why Adoptify AI? Because it delivers AI-powered digital adoption at enterprise scale. Interactive in-app guidance shortens onboarding while intelligent user analytics surface friction instantly. Automated workflow support resolves issues, so teams reclaim hours and budget. Faster onboarding and higher productivity arrive without sacrificing security or compliance. Consequently, your organization turns monitoring insights into continuous improvement. Start transforming workflows today by exploring Adoptify AI at Adoptify.ai.
Frequently Asked Questions
- How does an AI analytics dashboard improve business KPI visibility?
It links code execution to business outcomes using prebuilt ROI tiles and KPI mapping. This clear visualization empowers stakeholders to make informed decisions and enhance digital adoption. - What key monitoring dimensions should be tracked for effective AI performance?
Monitor model quality, data health, and operational performance. These dimensions help detect issues early, with Adoptify’s dashboard correlating signals to drive efficient, enterprise-scale digital adoption. - How does Adoptify AI enhance digital adoption and workflow efficiency?
Adoptify AI offers in-app guidance, intelligent user analytics, and automated workflow support. These features streamline onboarding, uncover friction points, and accelerate process improvement across teams. - How does role-specific alerting reduce fatigue and improve productivity?
By routing dynamic, threshold-based alerts to the appropriate teams, role-specific alerting minimizes noise and ensures prompt, focused responses, resulting in enhanced operational efficiency and reliable workflow governance.

FEATURED
How to Identify and Overcome Cultural AI Adoption Barriers
March 3, 2026
FEATURED
What Are the Most Common AI Adoption Challenges for Businesses
March 3, 2026
FEATURED
The Complete Guide to Building an AI Adoption Framework for 2026
March 2, 2026
FEATURED
Who Owns the Intellectual Property in Enterprise AI Adoption
March 2, 2026
FEATURED
7 Reasons To Embrace AI-Native Architecture
March 2, 2026